

Finance Exploration
-
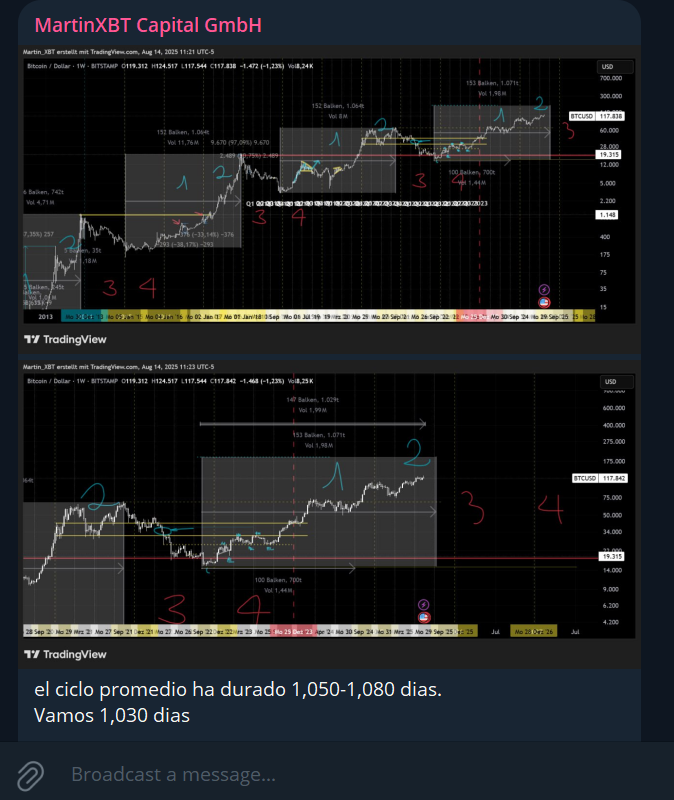
Charting
Introduction and conversation on how to properly chart financial pairs and different vehicles.
Timeframe explanation, Investment Thesis and Excecution.
-
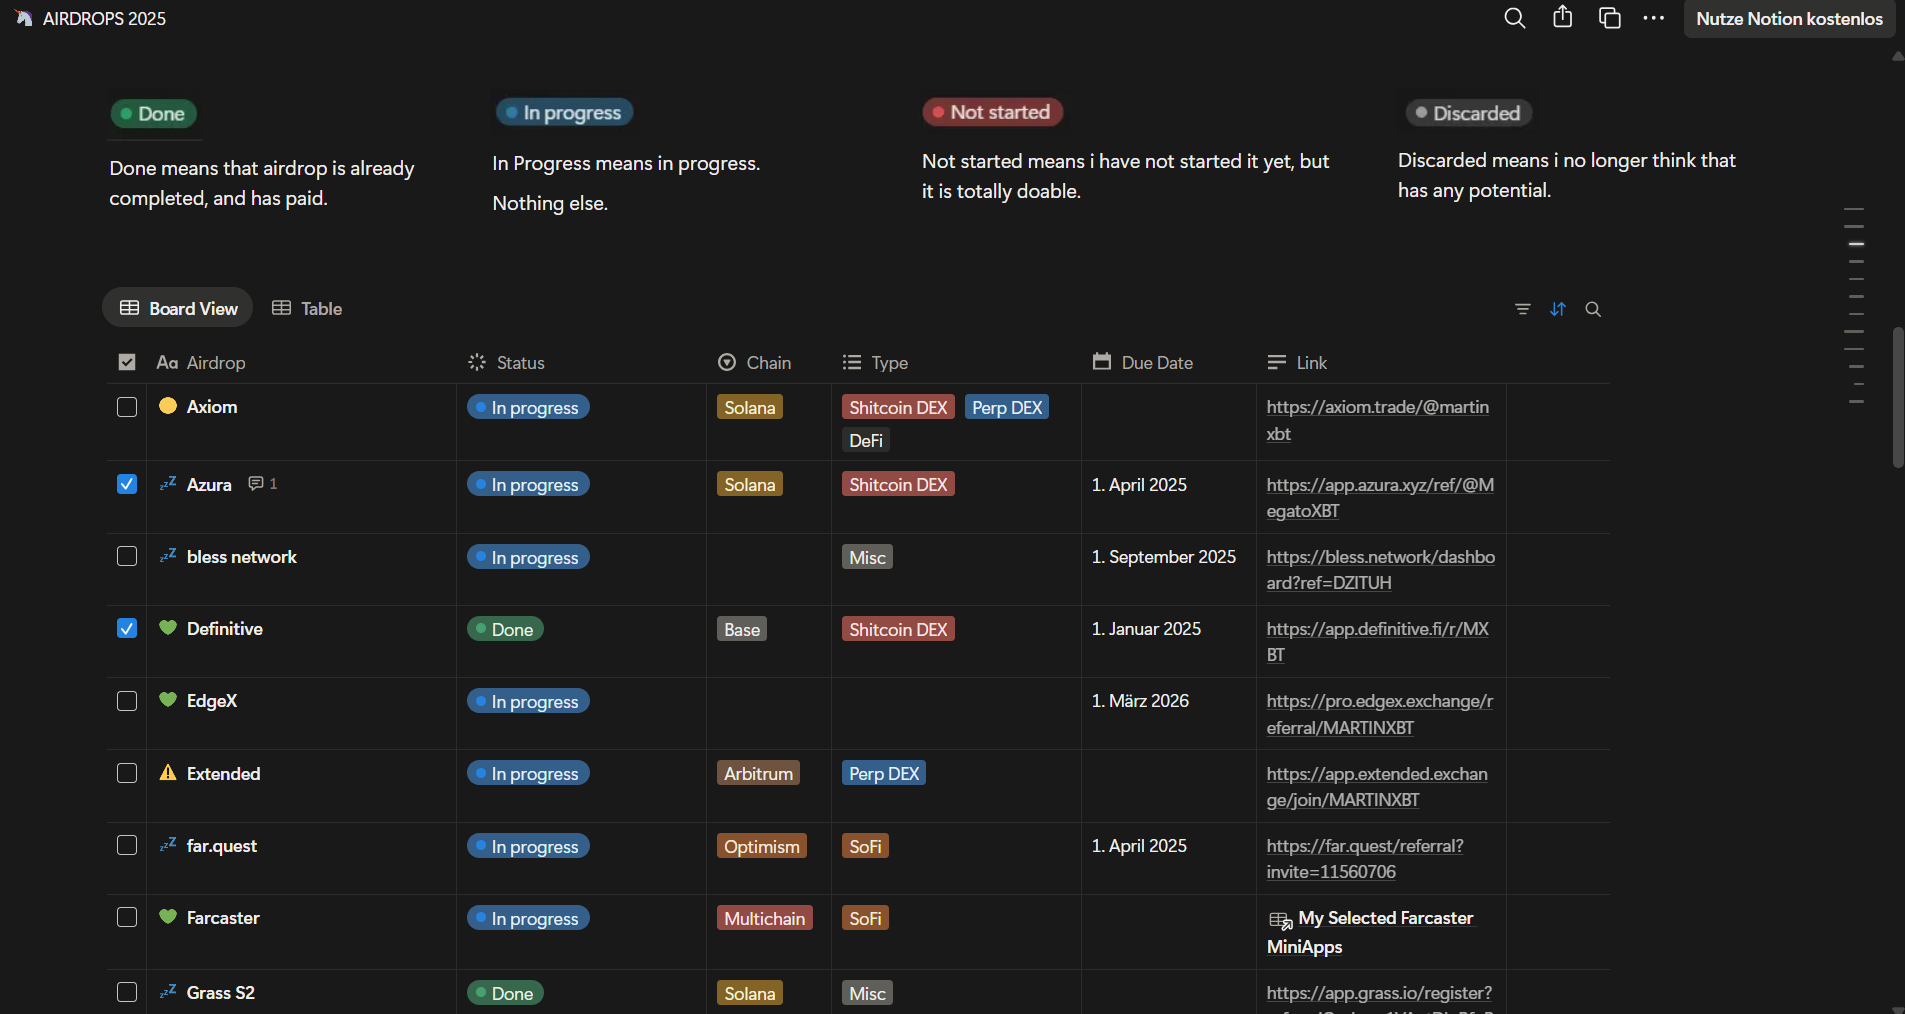
Decentralized Finance Exploration
General explanation and conversation on what to see, what to interact with, and how to actually earn money with airdrops.
-
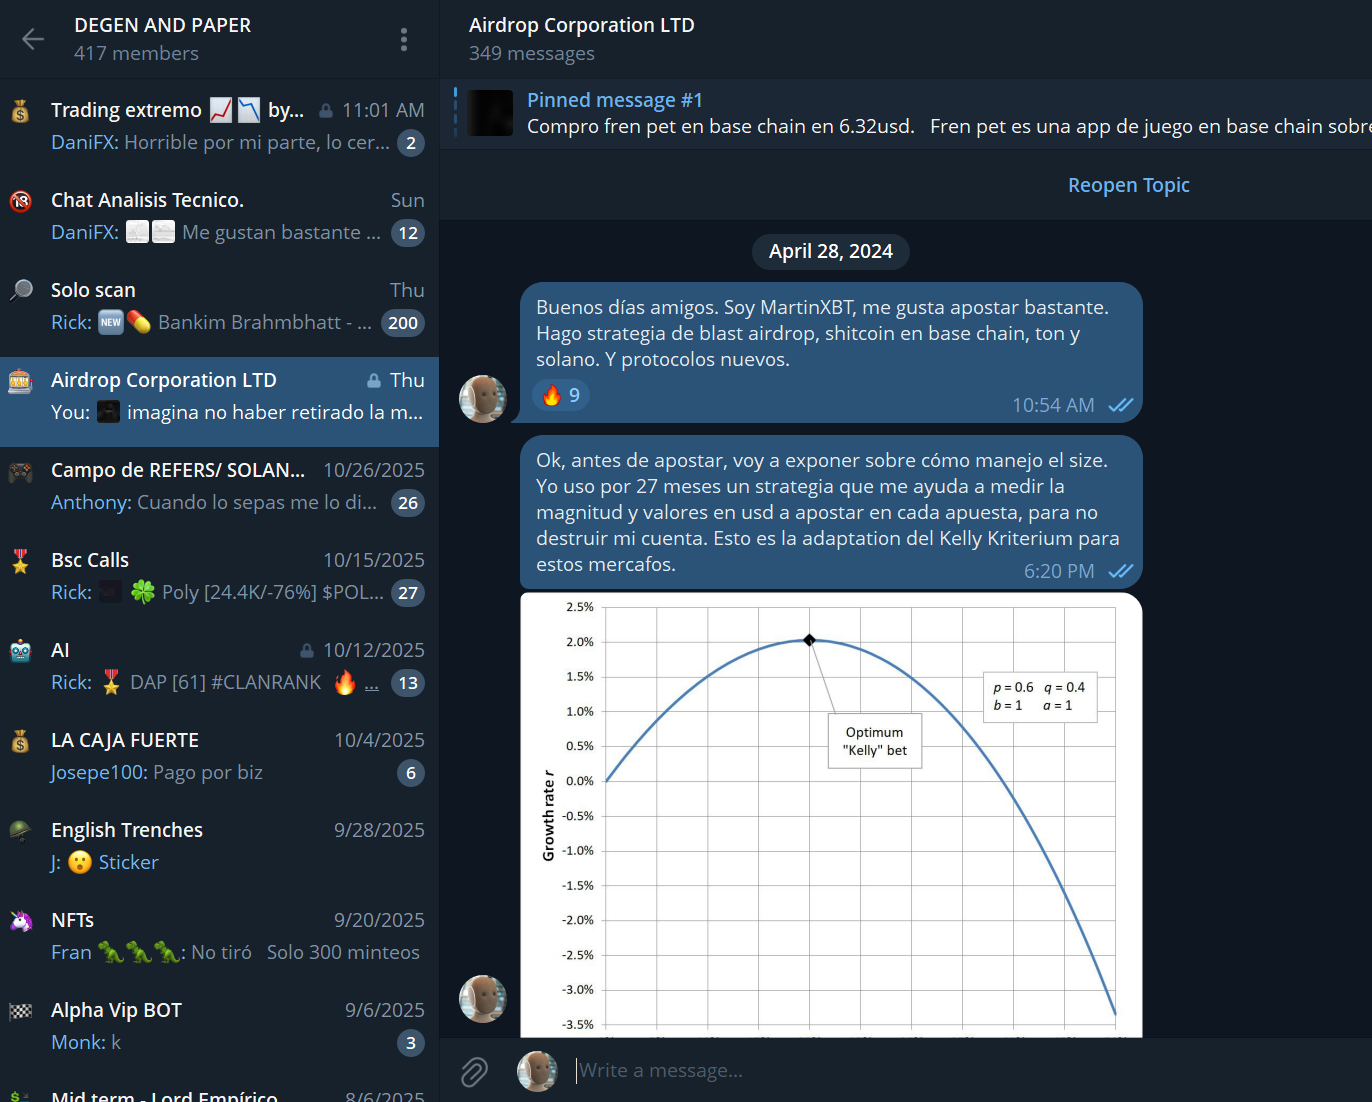
Community
Everyone is welcome to join to our free Finance Exploration community in different social media.
Conversation and chat is very important. Feedback is constantly expressed and communicated and new knowledge can be acquired very fast when interacting in a community.
MXBT does not charge money for any of these services. Information on the exploration of the financial markets and cryptocurrency is free and open to everyone.
Visit Twitter
Visit Airdrops Site
email us: crypto@mxbt.me